MarginSignal OS is an operational margin platform for service organizations. We calculate true Cost Per Resolution, detect structural leakage across repeats, transfers, escalations, and rework, and show where recoverable margin is hiding.
Reconstructs full resolution chains from event-level data — tracing every repeat, transfer, escalation, and rework loop to completion.
Assigns dollar impact to hidden friction using resolution-chain reconstruction and operational cost modeling. Every fault line gets a financial exposure number your CFO can act on.
Flags drift, repeat demand, escalation pressure, and transfer inflation over time. Continuous visibility into margin health — not a one-time report.
Your BI team builds dashboards. We reconstruct resolution chains and assign dollar impact to the friction hiding inside them.
Resolution-chain reconstruction is not a default BI model. It requires tracing every contact from first touch to final closure across systems.
CPR economics requires operational domain logic, not just dashboarding. SQL alone doesn't assign dollar impact to behavioral fault lines.
Fault-line mapping takes 15 years of operational pattern recognition, not a sprint with your analytics team.
Time-to-value is weeks, not quarters. Internal build cycles take 3-6 months to scope, build, validate, and get executive buy-in.
MarginSignal OS turns operational telemetry into an executive view of margin health, drift signals, proof windows, and fix accountability.
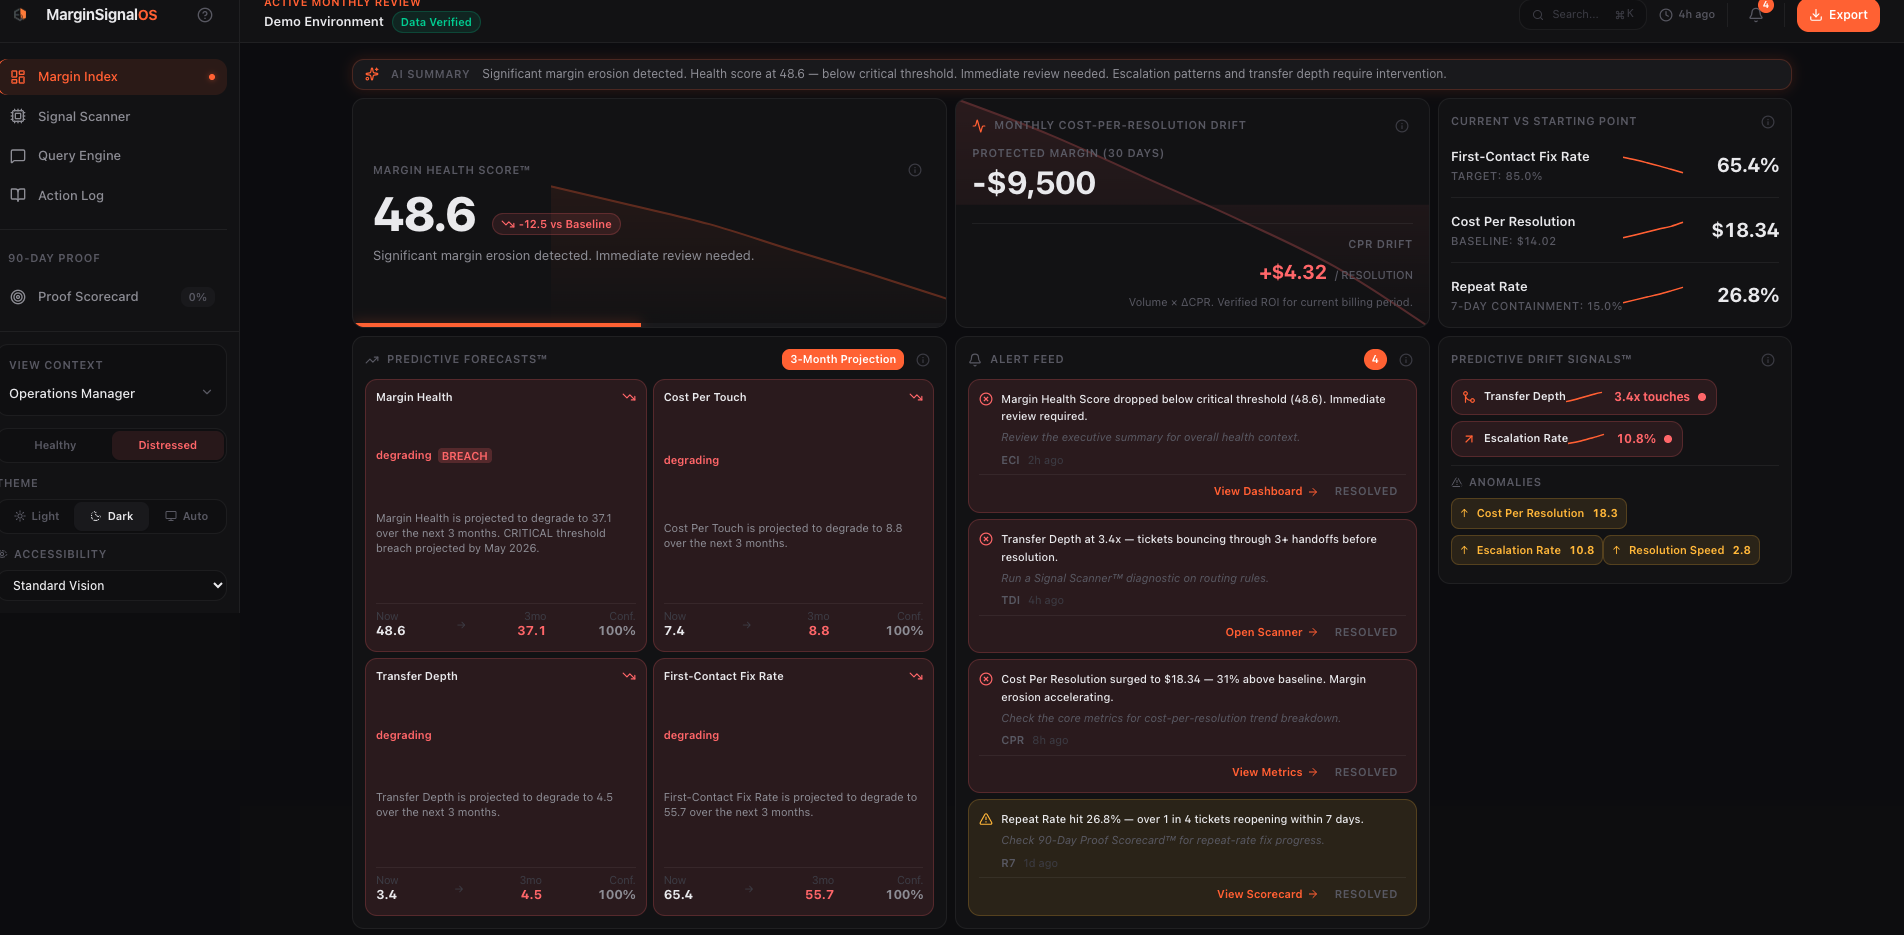
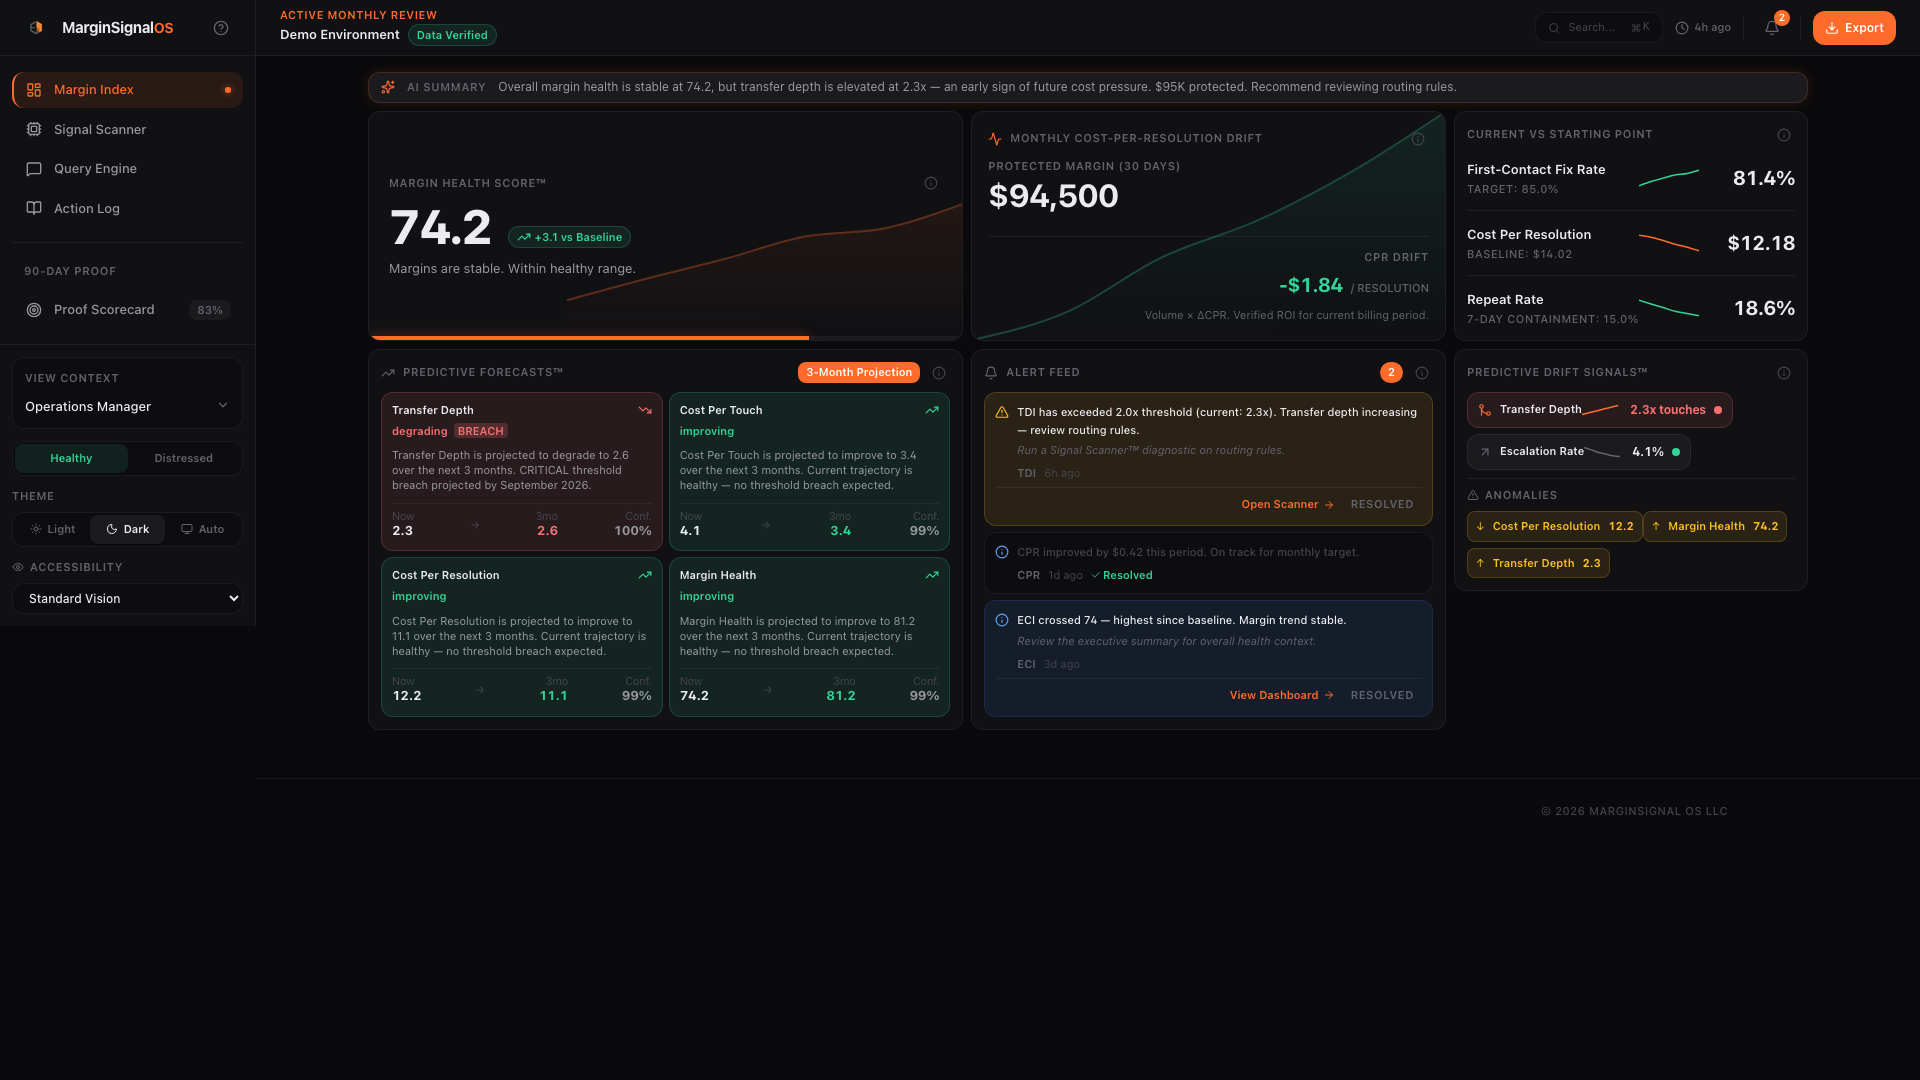
Illustrative sample environment. Margin Index dashboard showing margin health, CPR drift, alert conditions, predictive signals, and operating context in a single executive view. Click to enlarge.
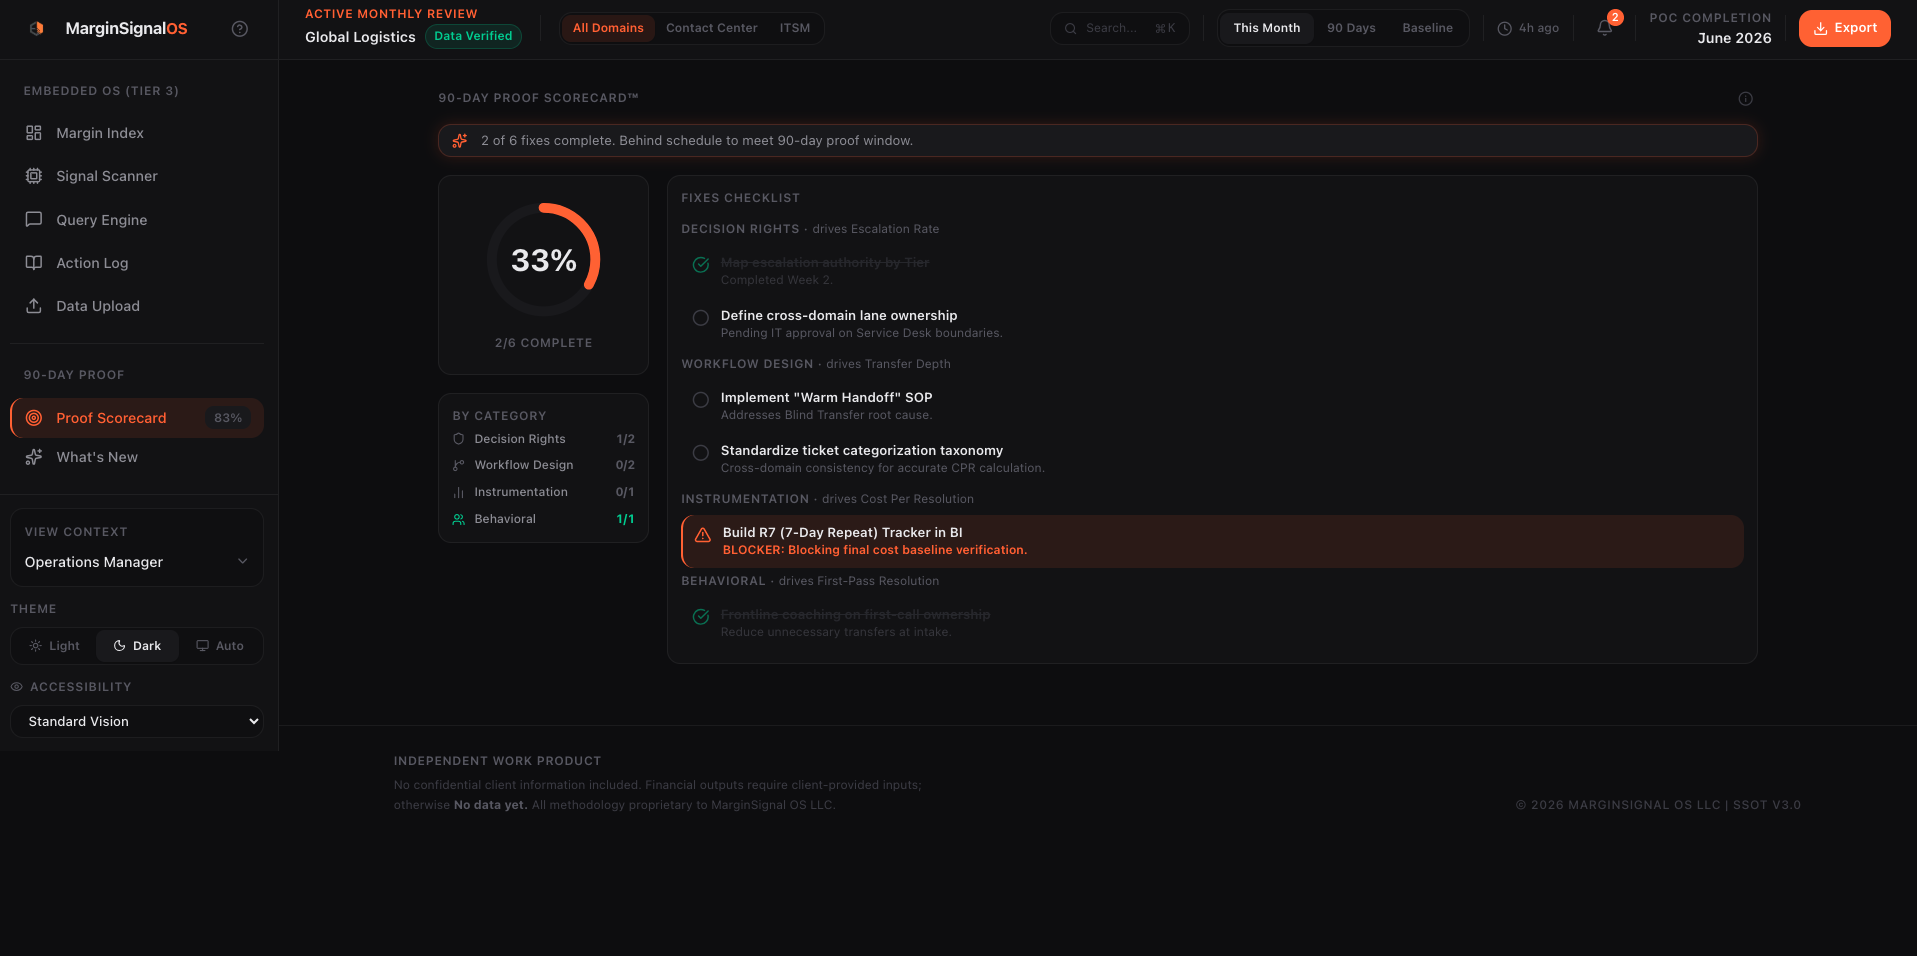
Illustrative sample environment. 90-day proof scorecard.
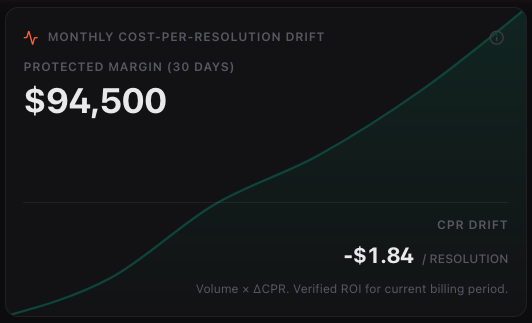
Illustrative sample environment. CPR drift view.
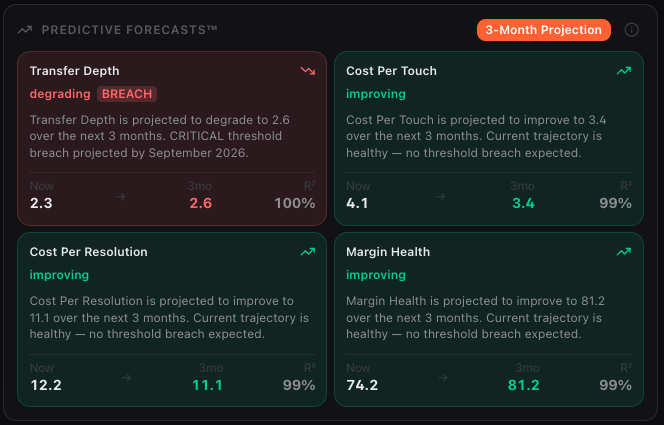
Illustrative sample environment. Predictive forecasts.
Available as part of the Signal Scan and Margin Diagnostic workflow.
See full sample deliverable setYour dashboards may be tracking activity without exposing resolution economics. The margin erosion happening inside repeat contacts, transfer chains, escalation loops, and dispatch revisits rarely surfaces in standard reporting.
These friction patterns compound silently — a 3% repeat rate is not 3% waste. It is 3% compounding across every resolution chain, every day, in every domain you operate.
↳ 22% of interactions required a callback within 7 days.
↳ The callbacks averaged 12 minutes.
↳ 3 of them escalated (Authority Misalignment).
↳ 1 dispatched a truck.
We map 12 operational Fault Lines to our CPR (Cost Per Resolution)™ economics model. Built from your operating data, not generic industry averages.
| The Pivot Point | Structural Fault Line | Predictive Driver | Financial Impact |
|---|---|---|---|
| Transfer Count > 2 | Ownership Diffusion Across Handoffs | Transfer Depth | AWAITING... |
| Escalation Returned | Escalation Bounce (Authority Misalignment) | Escalation Bounce Rate | AWAITING... |
| Revisit within 14 Days | Field Revisit Normalization | 7-Day Repeat Rate | AWAITING... |
We map your telemetry against 12 structural fault lines — the recurring patterns that inflate resolution cost. No 8-week baselining period required.
Every repeat contact, transfer chain, and escalation loop has a dollar value. We calculate the true Cost Per Resolution — not per call, per resolution — so you see what it actually costs to make a customer issue go away.
Every Fault Line is assigned a "Moves-First Metric." We deploy behavioral coaching kits and 30-day containment plans giving leaders exact architectural corrections.
Don't wait for a 4-week consulting engagement. Describe an operational symptom you are experiencing on the floor right now, and our engine will map it to a structural Fault Line.
Awaiting Telemetry
Real numbers. Real fault lines. Real margin recovery.
FCR reported at 78% — within target. But 22% of interactions generated a repeat within 7 days, and transfer chains were inflating handle times across every queue.
The diagnostic mapped their data against two fault lines — Ownership Diffusion and Escalation Bounce — and surfaced $1.2M in structural margin loss that had been invisible to their BI team for over two years.
"We had 14 dashboards. Not one of them showed us the $1.2M we were losing to repeat contacts and transfer chains. The MarginSignal diagnostic found it in three weeks."
— VP Claims Operations
See exactly what a diagnostic delivers — before you commit.
Every Signal Scan is backed by a findings guarantee: if we do not identify verified leakage equal to at least 3x the engagement fee, we refund the fee.
No API integrations. No database access. Built for low-friction security review using anonymized CSV exports via a secure browser uplink.
No multi-week baselining period. The CPR model generates findings from existing operational data, typically within the first engagement week.
Not software-only. Not consulting-only. A productized diagnostic that scales from first assessment to continuous monitoring.
Start with a free CPR Calculator or a $500 Diagnostic Readiness Assessment. Estimate your exposure in 48 hours with zero integration.
Signal Scan or full Margin Diagnostic. We ingest your data, reconstruct resolution chains, and deliver ranked fault lines with dollar impact.
Dashboard access, drift monitoring, alerting, audit trail, and ongoing executive review. Continuous visibility into margin health — not a one-time PDF.
This is not a one-time report. It is the beginning of continuous margin visibility.
Ongoing tracking of Cost Per Resolution trends. See whether fault lines are contracting or expanding month over month.
Automatic alerts when repeat demand, transfer inflation, or escalation pressure crosses governance thresholds.
Periodic proof tracking and executive briefings tied to verified margin recovery. Evidence your CFO can take to the board.
Every engagement ties to verified margin recovery. Findings guarantee on every Signal Scan.
Most teams start with a Signal Scan to quantify hidden resolution cost before committing to a larger diagnostic or pilot.
Start with the free CPR Calculator (60 seconds, benchmark estimate) or upgrade to the $500 Diagnostic Readiness Assessment for a fault-line breakdown with a 15-minute findings call.
Forensic diagnostic mapped against 12 structural fault lines. If we do not identify verified leakage equal to at least 3x the engagement fee, we refund the fee.
Everything in the Signal Scan plus a full CPR financial model, internal vs. BPO cost comparison, coaching dashboard, and a 30-day containment plan with implementation roadmap.
Enterprise & BPO networks: For multi-site deployments or performance-based gain-share engagements, contact us for custom scoping.
Clear assumptions. Defined logic. Auditable outputs. From raw data to recoverable margin.
30 days of anonymized interaction data. Standard CSV exports. No IT integration required. Encrypted transfer via secure upload link.
Every interaction traced from first touch to final resolution. Rework loops, escalation cascades, and handoff friction quantified at the dollar level.
10-slide executive briefing showing exactly where margin is hiding. Each leakage point quantified against COPC 8.0 benchmarks and industry standards.
Prioritized action plan with dollar values. 30/60/90 day implementation targets. Every recommendation tied to a specific recoverable amount.
Founder & Product Architect
MarginSignal OS exists because I got tired of seeing operations report Cost Per Call at $8 while the real Cost Per Resolution was $43. The gap is structural, not seasonal. I built the diagnostic to find it.
7-Day Repeat Rate: 22%
$1,200,000
Adjusters closing claims as resolved while 22% generate a second site visit within 14 days. Each revisit costs $180-$400 in direct dispatch plus reprocessing. Logged as new contacts, making them invisible to FCR reporting.
30-day coaching intervention on resolution verification protocols. Moves-First Metric: reduce 7-day repeat rate from 22% to 18% within first cycle.
Representative sample from a regional P&C insurance carrier diagnostic. See full sample output →
Every engagement is led directly by the founder and scoped for hands-on execution.
The gap between Cost Per Call and Cost Per Resolution is structural. It compounds daily. And it is invisible to every dashboard in your building. We find it.